리눅스 시스템을 운영할 때 별도로 모니터링 툴이 없다면 실시간 모니터링용으로 dstat 만한 툴이 없는 것 같아 기록으로 남겨둔다.
dstat 개요
dstat은 리눅스에서 실시간 시스템 성능 모니터링을 위한 강력한 CLI 도구입니다. CPU 사용량, 메모리 사용량, 디스크 입출력, 네트워크 트래픽 등 다양한 시스템 리소스를 실시간으로 한 화면에서 확인할 수 있습니다.
dstat의 주요 기능
- CPU, 메모리, 디스크, 네트워크, 프로세스 등의 실시간 모니터링
- 다양한 플러그인 지원 (예: MySQL, NFS, GPU 사용량 등)
- vmstat, iostat, netstat, mpstat 등을 하나의 명령어로 통합
- 출력 결과를 CSV 파일로 저장 가능 → 데이터 분석 및 로그 기록에 유용
- 컬러 출력 지원 → 가독성이 뛰어남
dstat 설치 방법
Amazon Linux / CentOS / RHEL
Ubuntu / Debian
macOS (Homebrew)
brew install dstat
Amazon Linux 2023 등 (패키지를 제공 하지 않는 OS)
소스코드 받아서 설치 한다.
### 1 코드 다운로드
$ git clone https://github.com/dstat-real/dstat.git
$ cd dstat

### 2 설치 해준다.
$ make
make -C docs docs
make[1]: Entering directory '/Admin/work/dstat/docs'
make[1]: Nothing to be done for 'docs'.
make[1]: Leaving directory '/Admin/work/dstat/docs'
Nothing to be build.

$ make install
install -Dp -m0755 dstat /usr/bin/dstat
install -d -m0755 /usr/share/dstat/
install -Dp -m0755 dstat /usr/share/dstat/dstat.py
install -Dp -m0644 plugins/dstat_*.py /usr/share/dstat/
install -Dp -m0644 docs/dstat.1 /usr/share/man/man1/dstat.1

### 3 명령어 실행
$ dstat
/usr/bin/env: ‘python’: No such file or directory

### 4 파이썬이 없다고 나오면 파이썬을 설치해주고 아래와 같이 python 명령이 없는경우 링크를 만들어준다.

$ sudo ln -s $(which python3) /usr/bin/python

### 5 명령어 실행

$ dstat
You did not select any stats, using -cdngy by default.
--total-cpu-usage-- -dsk/total- -net/total- ---paging-- ---system--
usr sys idl wai stl| read  writ| recv  send|  in   out | int   csw
  0   0 100   0   0| 706B   80k|   0     0 |   0     0 |  87   145
  0   0 100   0   0|   0     0 | 165B  923B|   0     0 | 131   214
  0   0  99   0   0|   0     0 |  46B  330B|   0     0 |  88   144
  0   0 100   0   0|   0     0 |  46B  330B|   0     0 | 103   168
  0   0 100   0   0|   0     0 |  46B  330B|   0     0 |  87   146
  0   0 100   0   0|   0     0 |  46B  660B|   0     0 |  93   143
  0   0 100   0   0|   0     0 | 122B  420B|   0     0 |  92   154
dstat 사용법
기본 사용법
- 기본적으로 CPU, 디스크, 네트워크, 메모리 정보를 초당 갱신하며 출력합니다.

dstat 옵션
1. CPU, 메모리, 디스크, 네트워크 모니터링
- -c : CPU 사용량
- -m : 메모리 사용량
- -d : 디스크 사용량
- -n : 네트워크 트래픽
- -g : page 사용량
- -i : interrupt 통계
- -s : swap 사용량
- -p : process 통계
- -t : timestamp 활성화

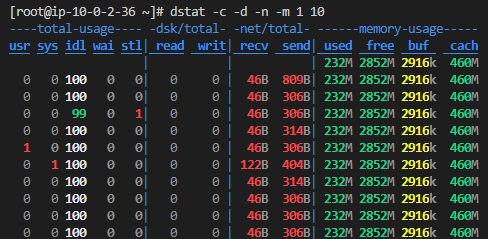
2. 1초 간격으로 10번 출력
- 1 → 1초 간격
- 10 → 10번 반복
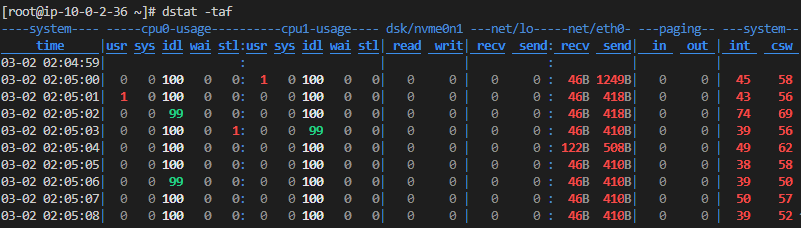
3. 시스템 전체 리소스 모니터링
- -t : 타임스탬프 포함
- -a : 기본적인 시스템 정보 모두 출력 (CPU, 디스크, 네트워크, 메모리), -cdngy와 동일 한 옵션
- -f : 파일 시스템 입출력 정보 추가
4. 네트워크 상세 트래픽 확인
- -n : 네트워크 트래픽 (KB 단위)
- --net-packets : 패킷 수 표시

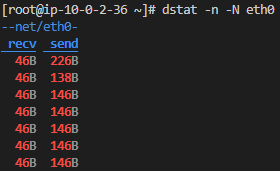
5. 특정 NIC의 트래픽 확인
- -N 디바이스명 : 특정 디바이스의 트래픽 확인
6. CSV 파일로 저장
dstat -tcmdn -o dstat_output.csv
- --output dstat_output.csv : 결과를 CSV 파일로 저장
→ 데이터 분석 및 시각화 가능


dstat vs 다른 명령어 비교
| 기능 | dstat | top | vmstat | iostat | netstat |
| CPU 사용률 | ✅ | ✅ | ✅ | ❌ | ❌ |
| 메모리 사용률 | ✅ | ✅ | ✅ | ❌ | ❌ |
| 디스크 I/O | ✅ | ❌ | ✅ | ✅ | ❌ |
| 네트워크 트래픽 | ✅ | ❌ | ❌ | ❌ | ✅ |
| 컬러 출력 | ✅ | ✅ | ❌ | ❌ | ❌ |
| CSV 저장 가능 | ✅ | ❌ | ❌ | ❌ | ❌ |
전체 옵션 확인
$ dstat --help

Dstat options:
  -c, --cpu             enable cpu stats
     -C 0,3,total          include cpu0, cpu3 and total
  -d, --disk            enable disk stats
     -D total,sda          include sda and total
  --dm, --device-mapper enable device mapper stats
     -L root,home,total    include root, home and total
  --md, --multi-device  enable multi-device driver stats
     -M total,md-0         include md-0 and total
  --part, --partition   enable disk partition stats
     -P total,sdb2         include sdb2 and total
  -g, --page            enable page stats
  -i, --int             enable interrupt stats
     -I 9,CAL              include int9 and function call interrupts
  -l, --load            enable load stats
  -m, --mem             enable memory stats
  -n, --net             enable network stats
     -N eth1,total         include eth1 and total
  -p, --proc            enable process stats
  -r, --io              enable io stats (I/O requests completed)
  -s, --swap            enable swap stats
     -S swap1,total        include swap1 and total
  -t, --time            enable time/date output
  --time-adv            enable time/date output (with milliseconds)
  -T, --epoch           enable time counter (seconds since epoch)
  --epoch-adv           enable time counter (milliseconds since epoch)
  -y, --sys             enable system stats

  --aio                 enable aio stats
  --fs, --filesystem    enable fs stats
  --ipc                 enable ipcstats
  --lock                enable lockstats
  --raw                 enable rawstats
  --socket              enable socketstats
  --tcp                 enable tcpstats
  --udp                 enable udpstats
  --unix                enable unixstats
  --vm                  enable vmstats
  --vm-adv              enable advanced vm stats

  --list                list all available plugins
  --plugin              enable external plugin by name, see --list

  -a, --all             equals -cdngy (default)
  -f, --full            automatically expand -C, -D, -I, -N and -S lists
정리
- dstat은 다양한 시스템 성능 정보를 통합하여 실시간으로 모니터링할 수 있는 강력한 도구
- vmstat, iostat, netstat 등의 기능을 하나의 명령어로 대체 가능
- CSV 파일 저장 기능이 있어 로그 기록 및 분석에 유용
- top처럼 실시간 업데이트되며, 컬러 출력을 지원하여 가독성이 높음
서버 cpu, mem, disk, network 성능을 빠르게 모니터링 할 때 이만한 도구가 없다. 온튠이 부럽지 않다. ㅎㅎㅎ
기타
궁금해서 찾아보니 dstat은 아래의 dagwieers 아저씨가 개발 했으나 현재는 dool 이라는 이름의 프로젝트로 이관 되었다.
원인은 redhat이 해당이름으로 자체 유틸리티로 상용화 출시해버려서 변경 한 것 으로 보인다.
dagwieers 씨는 이런 상황에 대해 싸울 생각이 없다고 한다.
뭐 어쨋건 dagwieers 님 감사합니다. 머나먼 코레아에서 잘 쓰고 있습니다.

참고링크
https://github.com/dstat-real/dstat
GitHub - dstat-real/dstat: Versatile resource statistics tool (the real one, not the Red Hat clone)
Versatile resource statistics tool (the real one, not the Red Hat clone) - dstat-real/dstat
github.com
dstat 프로젝트를 대체 하는 dool 프로젝트의 git 주소
'IT > LINUX' 카테고리의 다른 글
| [RHEL 8/9] NetworkManager를 사용할 때 IP변경 주의 사항 (0) | 2025.02.21 |
|---|---|
| LINUX에서 NIC CRC 오류 확인 방법 (0) | 2025.02.19 |
| [Linux] 리눅스 명령어 패키지 찾기 (0) | 2024.12.13 |
| [Linux] iPerf 패키지 사용방법 (4) | 2024.11.12 |
| [Linux] 네트워크 전송량 제한 하기 tc 명령어 사용 (0) | 2024.11.12 |
댓글